How to stand out in the world of visual content?

It's simple: create an interactive infographic. OK, maybe it's not that simple, but we already wrote about it here. Nevertheless, experts claim that animations, especially ones created in HTML5, are the future of infographics. Let's take a look at how futuristic the current designs are.
Katarzyna Petruk
O AUTORZE

Katarzyna Petruk

Professional pacifier of unwanted emotions. Since many years she leaves no doubt that her biggest love is Iceland. A strong personality with an assertive attitude.

★ 4 minutes czytania

Even though an interactive inforgraphic has a crushing advantage over its older sister – a static infographic – it is still rarely used. Why? Of course, the main reason is that it’s more difficult to create. What does this interactive form actually mean? In its basic version, an interactive form includes:

  • scrolling,
  • click/unfold function to show more information,
  • transition or multipage formats.

There is also place here for more advanced elements, such as animations, e.g. kinetic typography (animated text). Such multifunction motion graphics remain the least popular format because they are expensive to create, must be very well written and designed so that they successfully keep the viewers’ attention.  But once prepared, a design of this kind is a long-term investment – it can be used to improve online visibility and brand awareness for years (as it can be updated and remains available).

Regardless of how complex it is, the intuitive and seemingly simple animated infographic is backed by a huge amount of creative thinking, initially presented as a hand drawing and followed by tedious programming work. All that because the UI/UX (user interface/user experience) is particularly important – it plays a key role in the brand-customer relation.

UI/UX is not only about color and design, but also everything that represents the identity of a product and brand, and wins trust in relation with the user.

Experts on content marketing all agree: if you treat visual content creation seriously and appreciate its ability to educate and to provide data in a simple form, you need to consider using an interactive infographic for your company. First, it will make you stand out among all the other statistic graphics. You’re offering a more fresh and more engaging experience to your recipient. We must note that online applications and interactive infographics are the most practical solution when it comes to data transfer, they allow to interact with audience in real time and to create varied forms of marketing activities. But above all this – let’s be frank about it – they can be simply good fun for the recipient. The subjects vary considerably, so it’s hard to talk about the mainstream when it comes to the choice of content. It is always worth remembering about the basics, that is: what main goals does content play in content marketing – it should entertain, educate and inspire. And that’s from the customer’s perspective, not the company’s.

From the corporate point of view, an interactive infographic can be:

  • all sorts of company reports (CSR, annual) and briefs,
  • information about how you change the world, particularly when your company’s model is an eco one and you care about sustainability: the production type used in your company and its impact on the environment, the background of how products are made (life cycle),
  • individual and global matters relating to the production and use of products/services in your business sector (ecology, resources used, statistics and geographic/time differences e.g. in the level of advancement in a given area, your business’ connections with global phenomena or human life and body),
  • apps that work as calculators or comparison for juxtaposing one type of data with another (e.g. energy provider can help calculate the level of savings resulting from changing certain habits and can show how much an individual change can make on a global scale).

90% of information transmitted to our brains is visual. People remember 80% of what they’ve seen and only 20% of what they’ve read.

Where to start? Get inspired!

Here’s a few of examples we chose, creme de la creme of interactive infographics from the recent years. Even the simple ones can be visually stunning and make the viewer think (about many different matters…*). The more developed its interactivity and animations the greater the joy of learning.

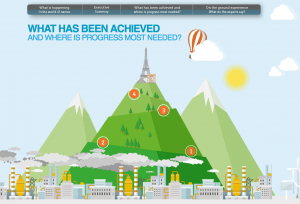
To start with, here’s a pleasing example of how the problem of global climate change was illustrated in a report by NAMA agency.

zrzut-ekranu-2016-12-28-o-10-07-11
Another example: advanced online technology available for newer versions of browsers – a map of every ship on the planet in 2012. Here’s a hint: if you employ someone to read your data, you’ll get the impression of watching a movie.

zrzut-ekranu-2016-12-27-o-15-09-21
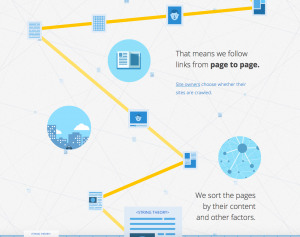
Google example showing that even scrolling itself can be interesting. An interactive graphic with the typical elements of scrolling, windows opening and a little bit of animation. The subject is naturally how an online network works.

zrzut-ekranu-2016-12-28-o-10-30-27
And here’s an example of scrolling and a larger amount of animation created by Ustream, a live video broadcasting app.

zrzut-ekranu-2016-12-28-o-10-55-14
* Of course, not all thoughts are going to make you happy – for example this You Vs. John Paulson infographic shows how many minutes it takes fund manager John Paulson to earn the equivalent of your annual salary…

zrzut-ekranu-2016-12-27-o-14-57-54

Interactive infographic as lucky seven: 1. allows to update information easily 2. is available all the time 3. has a viral potential and increases visibility in social media (take a look at how Acciona did it, here's the success story of the company's blog) 4. interactive character of the elements makes information easier and more pleasant to digest 5. makes you memorable. The visual effect strengthens the brand and company's identity. Visual content is more convincing and resonates for longer 6. engages the recipient for longer 7. can provide deeper information in larger amounts  

Kategorie: school of contentic

ZAPISZ SIĘ NA NASZ NEWSLETTER


Wartościowy artykuł raz w tygodniu na Twoją skrzynkę.

Zero spamu. Przestaniemy być ciekawi, wypiszesz się w każdej chwili.

Oświadczam, że dane podaję dobrowolnie w celu zapisania się do newslettera, a Administrator danych – spółka AUDE sp. z o.o. z siedzibą w Warszawie (02-620), ul. Puławska 118A, KRS 0000216511, REGON 015796792, NIP 5252306020 – przekazał mi informacje, o których mowa w art. 13 ust. 1 i 2 Rozporządzenia Parlamentu Europejskiego i Rady (UE) 2016/679 z dnia 27 kwietnia 2016 r. w sprawie ochrony osób fizycznych w związku z przetwarzaniem danych osobowych i w sprawie swobodnego przepływu takich danych oraz uchylenia dyrektywy 95/46/WE (dalej jako „RODO”) – informacje te są dostępne tutaj. Wyrażam dobrowolnie i w sposób świadomy zgodę na przetwarzanie przez spółkę AUDE sp. z o.o. z siedzibą w Warszawie (02-620), ul. Puławska 118A, KRS 0000216511, REGON 015796792, NIP 5252306020 moich danych osobowych w celu otrzymywania newslettera i przekazywania mi informacji o oferowanych przez nią produktach, usługach, promocjach i konkursach przez czas niezbędny do realizacji wyżej wymienionego celu, aż do cofnięcia wyrażonej zgody.

Wyrażam zgodę na otrzymywanie od spółki AUDE sp. z o.o. z siedzibą w Warszawie (02-620), ul. Puławska 118A, KRS 0000216511, REGON 015796792, NIP 5252306020 informacji handlowych drogą elektroniczną na podany przeze mnie adres poczty elektronicznej zgodnie z ustawą z dnia 18 lipca 2002 r. o świadczeniu usług drogą elektroniczną (t.j. Dz. U. z 2017 r., poz. 1219 ze zm.). Wyrażam również zgodę na używanie przez spółkę AUDE sp. z o.o. z siedzibą w Warszawie (02-620), ul. Puławska 118A, KRS 0000216511, REGON 015796792, NIP 5252306020 telekomunikacyjnych urządzeń końcowych i automatycznych systemów wywołujących dla celów marketingu bezpośredniego, zgodnie z ustawą z dnia 16 lipca 2004 r. - Prawo telekomunikacyjne (t.j. Dz. U. z 2017 r. poz. 1907 ze zm.). Wyrażenie zgody jest dobrowolne.